One of the things I was finding I was missing was when restoring databases and adding into availability groups. It was quite easy to see in SSMS when databases, were synchronized or syncronizing or had just plain, fell over when adding into secondary nodes as sometimes seemed to happen.
It was plain to see in SSMS not so with ADS, the database in the server manage element just didn’t show up if looking at SQL 2008 Secondary using mirroring for example.
Always on secondaries showed up in the database list but not as an Always ON database and it allowed you to click on the database and drill through, not that there was anything to see, it would just say The database X is not accessible, useful. You certainly wouldn’t want to do that for every database!
So a Dashboard was in order to give me some more control. The following steps created the dashboard, there is always more than one way to achieve things as well so I have also explained that as well.
1) Write the SQL that you want to use. in my case, this is it here below. Using a clever technique that allows me to run against different versions of SQL with different syntax by using EXEC. So if using mirroring it will report the data or if it’s using always on
-- DatabaseStatus.sql #SQL
--Get version so we can run different quiries based on version
DECLARE @SQLServerInstanceVersion INT
SELECT @SQLServerInstanceVersion=

FLOOR(SUBSTRING(CAST(SERVERPROPERTY('ProductVersion')AS VARCHAR(10)),1,4))

IF @SQLServerInstanceVersion >= 10
BEGIN

SELECT
Name,
state_desc,
CASE
WHEN mirroring_state_desc IS NULL THEN ''
ELSE mirroring_state_desc END AS synchronization_state_desc
FROM sys.databases d
INNER JOIN sys.database_mirroring dm ON d.database_id = dm.database_id
END
ELSE
BEGIN

EXEC(' SELECT sd.Name,
CASE WHEN sd.is_read_only =1 THEN sd.state_desc + ''(READONLY)'' ELSE sd.state_desc END AS state_desc

, ISNULL(ag.synchronization_state_desc,'''') AS synchronization_state_desc
FROM Master.sys.databases sd
LEFT JOIN master.sys.dm_hadr_database_replica_states ag ON sd.database_id=ag.database_id
WHERE is_local IS NULL or is_local=1
ORDER BY sd.Name'
2) In ADS Ctrl+, to open the setting
3) Type Dashboards (including the s)
4) Click Dashboards > Server: Properties and Edit in json settings
- Find the dashbaoard.server.widgets section ( as below)
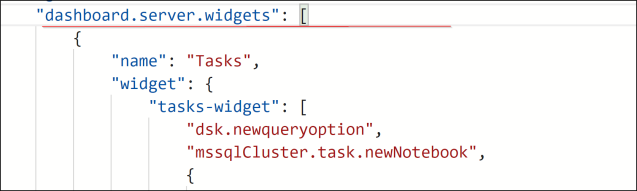
5. After the [ where the red line is paste the following code in. You can edit the code to point to different queries each time. Then go back into ADS and position the dashboard elements how you want and they will be updated. There is another way of creating the code at the bottom of the blog post.
{
“name”: “Database Status”,
“gridItemConfig”: {
“sizex”: 2,
“sizey”: 2,
“col”: 3,
“row”: 1
},
“widget”: {
“insights-widget”: {
“type”: {
“table”: {
“dataDirection”: “horizontal”,
“columnsAsLabels”: true,
“labelFirstColumn”: false,
“legendPosition”: “top”
}
},
“queryFile”: “c:\\SQLServerSolutions\\ADS\\DatabaseStatus.sql”
}
}
},
So it looks like the following
 Save it and refresh the dashboard, might need to reopen and you get the following. showing the different status and if its part on and AG or mirroring

The alternative method
- run the query that you want to create the dashboard for in ADS on the right-hand side are several icons. Choose the one that looks like a bar chart and click

- You can then choose the type of chart you want. In my case, it’s just a table of results I want
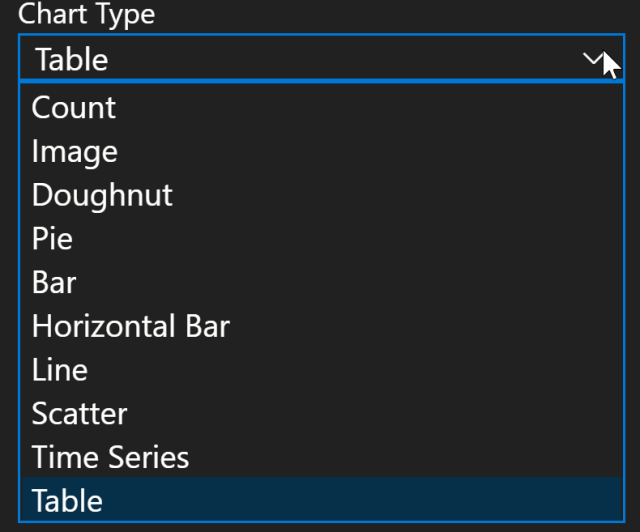
- ADS will then open a new window with the following codeand it creates for you the following, you still need to plug it in
